
thztools.etfe#
- thztools.etfe(x, y, *, n=None, dt=None, window=None, axis=-1)[source]#
Calculate the empirical transfer-function estimate and the frequency base.
Given the real input
xand the real outputy, returns the ratio of their discrete Fourier transforms,h_f = scipy.fft.rfft(y) / scipy.fft.rfft(x).- Parameters:
- xarray_like
Input waveform.
- yarray_like
Output waveform.
- nint or None, optional
Number of points along transformation axis to use. If
nis greater thanlen(x), pad the signal with zeroes ton. Ifnless thanlen(x), signal is truncated. Default is None, which setsn = len(x).- dtfloat or None, optional
Sampling time, normally in picoseconds. Default is None, which sets the sampling time to
thztools.options.sampling_time. If bothdtandthztools.options.sampling_timeareNone, the sampling time is set to 1.0.- windowstr or None, optional
Name of a window function from
scipy.signal.windows. Default is None, which applies a Tukey window withalpha = 0.5.- axisint or None, optional
Fourier transformed axis. If not given, the last axis is used.
- Returns:
- h_fcomplex ndarray
Empirical transfer function estimate.
- fndarray
Array of length
n//2 + 1of frequency samples corresponding tonumpy.fft.rfftfreq.
- Raises:
- ValueError
If
windowis not a valid name inscipy.signal.windows.
- Warns:
- UserWarning
If
thztools.options.sampling_timeand thedtparameter are both notNoneand are set to differentfloatvalues, the function will set the sampling time todtand raise aUserWarning.
Notes
This function computes the frequency axis for the real FFT:
f = np.fft.rfftfreq(n, d=dt)Examples
>>> from matplotlib import pyplot as plt
>>> import numpy as np
>>> import thztools as thz
>>> n, dt = 256, 0.05
>>> a, eta = 0.5, 1
>>> sigma_alpha, sigma_beta, sigma_tau = 1e-4, 1e-2, 1e-3
>>> t = thz.timebase(n, dt=dt)
>>> mu = thz.wave(n, dt=dt)
>>> z = thz.scaleshift(mu, dt=dt, a=a, eta=eta)
>>> noise_model = thz.NoiseModel(sigma_alpha, sigma_beta, sigma_tau, dt=dt)
>>> x = mu + noise_model.noise_sim(mu, axis=0, seed=1234)
>>> y = z + noise_model.noise_sim(z, axis=0, seed=5678)
>>> h_f, f = thz.etfe(x, y, dt=dt, window=None, axis=-1)
>>> print(f[:3])
[0. 0.078125 0.15625 ]
>>> def frfun(omega, a, eta):
...     return a * np.exp(-1j * omega * eta)
>>>
>>> p0 = (a, eta)
>>> result = thz.fit(
...     frfun, x, y, p0, noise_parms=(sigma_alpha, sigma_beta, sigma_tau), dt=dt
... )
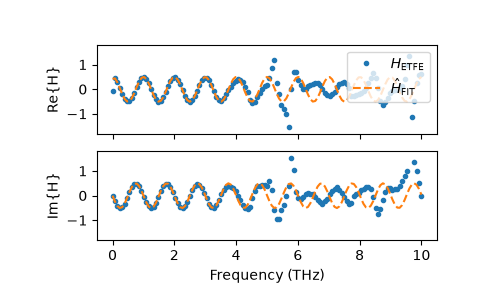
>>> fig, axs = plt.subplots(2, 1)
>>>
>>> axs[0].plot(f, np.real(h_f), ".", label=r"$H_{\mathrm{ETFE}}$")
>>> axs[0].plot(
...     f, np.real(result.frfun_opt), "--", label=r"$\hat{H}_{\mathrm{FIT}}$"
... )
>>> axs[0].set_ylabel("Re{H}")
>>> axs[0].set_ylim(-1.8, 1.8)
>>> axs[0].tick_params(labelbottom=False)
>>> axs[0].legend(loc="upper right")
>>> axs[1].plot(f, np.imag(h_f), ".")
>>> axs[1].plot(f, np.imag(result.frfun_opt), "--")
>>> axs[1].set_xlabel("Frequency (THz)")
>>> axs[1].set_ylabel(r"Im{H}")
>>> axs[1].set_ylim(-1.8, 1.8)
>>>
>>> fig.subplots_adjust(hspace=0.2)
>>> plt.show()