thztools.scaleshift#
- thztools.scaleshift(x, *, dt=None, a=None, eta=None, axis=-1)[source]#
Rescale and shift waveforms.
- Parameters:
- xarray_like
Data array.
- dtfloat or None, optional
Sampling time, normally in picoseconds. Default is None, which sets the sampling time to
thztools.options.sampling_time. If bothdtandthztools.options.sampling_timeareNone, the sampling time is set to1.0. In this case,etamust be given in units of the sampling time.- aarray_like, optional
Scale array.
- etaarray_like, optional
Shift array.
- axisint, optional
Axis over which to apply the correction. If not given, applies over the last axis in
x.
- Returns:
- x_adjndarray
Adjusted data array.
- Warns:
- UserWarning
If
thztools.options.sampling_timeand thedtparameter are both notNoneand are set to differentfloatvalues, the function will set the sampling time todtand raise aUserWarning.
Examples
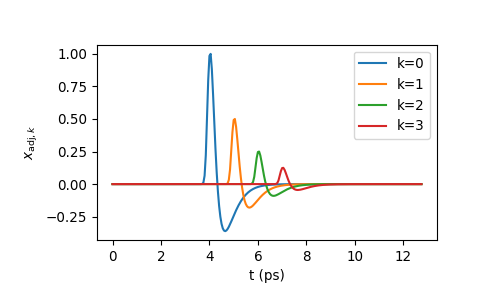
The following example makes an array with 4 identical copies of the signal
mureturned bywave. It then usesscaleshiftto rescale each copy bya = [1.0, 0.5, 0.25, 0.125]and shift it byeta = [0.0, 1.0, 2.0, 3.0].>>> import numpy as np >>> import thztools as thz >>> from matplotlib import pyplot as plt >>> n, dt = 256, 0.05 >>> t = thz.timebase(n, dt=dt) >>> mu = thz.wave(n, dt=dt) >>> m = 4 >>> x = np.repeat(np.atleast_2d(mu), m, axis=0) >>> a = 0.5 ** np.arange(m) >>> eta = np.arange(m) >>> x_adj = thz.scaleshift(x, a=a, eta=eta, dt=dt)
>>> plt.plot(t, x_adj.T, label=[f"{k=}" for k in range(4)])
>>> plt.legend()
>>> plt.xlabel("t (ps)")
>>> plt.ylabel(r"$x_{\mathrm{adj}, k}$")
>>> plt.show()