thztools.wave#
- thztools.wave(n, *, dt=None, t0=None, a=1.0, taur=None, tauc=None, fwhm=None)[source]#
Simulate a terahertz waveform.
- Parameters:
- nint
Number of samples.
- dtfloat or None, optional
Sampling time, normally in picoseconds. Default is None, which sets the sampling time to
thztools.options.sampling_time. If bothdtandthztools.options.sampling_timeareNone, the sampling time is set to 1.0.- t0float or None, optional
Pulse location, normally in picoseconds. Default is
0.3 * n * dt.- afloat, optional
Peak amplitude. The default is one.
- taur, tauc, fwhmfloat or None, optional
Current pulse rise time, current pulse decay time, and laser pulse FWHM, respectively. The defaults are
6.0 * dt,2.0 * dt, and1.0 * dt, respectively.
- Returns:
- xndarray
Signal array.
- Warns:
- UserWarning
If
thztools.options.sampling_timeand thedtparameter are both notNoneand are set to differentfloatvalues, the function will set the sampling time todtand raise aUserWarning.
Notes
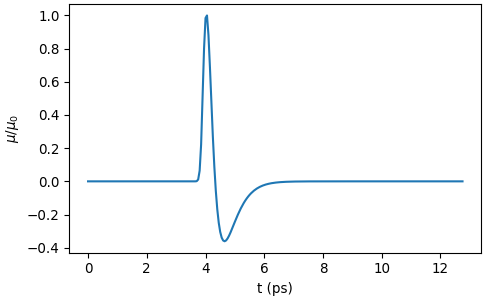
This function uses a simplified model for terahertz generation from a photoconducting switch [1]. The impulse response of the switch is a current pulse with an exponential rise time \(\tau_r\) and an exponential decay (capture) time, \(\tau_c\),
\[I(t) \propto (1 - e^{-t/\tau_r})e^{-t/\tau_c},\]which is convolved with a Gaussian laser pulse with a full-width, half-maximum pulsewidth of
fwhm.References
[1]D. Grischkowsky and N. Katzenellenbogen, “Femtosecond Pulses of THz Radiation: Physics and Applications,” in Picosecond Electronics and Optoelectronics, Technical Digest Series (Optica Publishing Group, 1991), paper WA2, https://doi.org/10.1364/PEO.1991.WA2.
Examples
The following example shows the simulated signal \(\mu(t)\) normalized to its peak magnitude, \(\mu_0\).
>>> import thztools as thz
>>> from matplotlib import pyplot as plt
>>> n, dt = 256, 0.05
>>> t = thz.timebase(n, dt=dt)
>>> mu = thz.wave(n, dt=dt)
>>> _, ax = plt.subplots(layout="constrained")
>>> ax.plot(t, mu)
>>> ax.set_xlabel("t (ps)")
>>> ax.set_ylabel(r"$\mu/\mu_0$")
>>> plt.show()
