
Rescale and shift waveform#
Objects from thztools: scaleshift, timebase, wave.
[1]:
import numpy as np
from matplotlib import pyplot as plt

import thztools as thz
Set the simulation parameters#
[2]:
n = 256  # Number of samples
dt = 0.05  # Sampling time [ps]
a = 0.5  # Scale factor
eta = 1.0  # Delay [ps]
Simulate input and output waveforms#
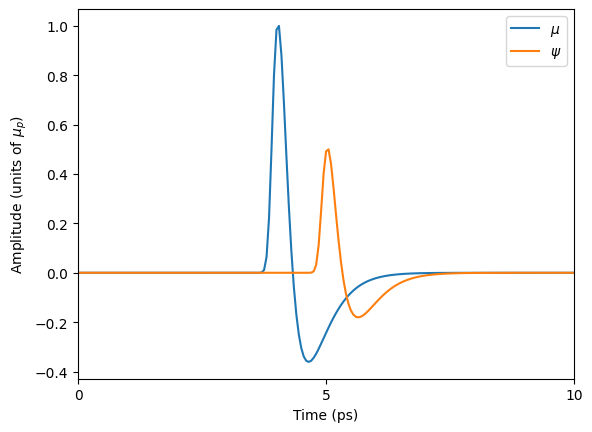
Use wave to generate a terahertz time-domain waveform mu with n = 256 samples, then use scaleshift to generate a second waveform psi that is rescaled by a factor a and delayed by eta. The timebase function returns the timebase for both waves.
[3]:
t = thz.timebase(n, dt=dt)
mu = thz.wave(n, dt=dt)
psi = thz.scaleshift(mu, dt=dt, a=a, eta=eta)
Show the input and output waveforms#
[4]:
_, ax = plt.subplots()

ax.plot(t, mu, label=r"$\mu$")
ax.plot(t, psi, label=r"$\psi$")

ax.legend()

ax.set_xlabel("Time (ps)")
ax.set_ylabel(r"Amplitude (units of $\mu_{p})$")

ax.set_xticks(np.arange(0, 11, 5))
ax.set_xlim(0, 10)

plt.show()